Feature Comparison of Self-Service Analytics Tools
| Feature/Tool | Qlik Sense | Sisense | Looker | TIBCO Spotfire | Power BI | Tableau |
| Intuitive User Interface for Business Users | High | Medium | High | Medium | High | High |
| Flexibility | High | Medium | Medium | Low | Medium | High |
| Accessing different data sources | Medium | Medium | Medium | Medium | High | High |
| Blending Data sources | Medium | High | Medium | Medium | Medium | Medium |
| Data Preparation Tools | High | High | N/A | Medium | High | Medium |
| Visualization Options | High | Medium | Medium | Low | High | High |
| Adding pages | High | N/A | N/A | High | High | High |
| Create Filters | Medium | High | High | Medium | High | High |
| Create Calculated Columns | High | High | High | Medium | High | High |
| Predictive Analytics | Low | Medium | Low | High | Medium | Medium |
| Performance | High | High | High | Medium | High | High |
| Mobile Version | High | High | N/A | High | High | High |
| Sharing Features | Medium | High | Medium | Medium | High | High |
| Additional features | Medium | Medium | Medium | Medium | High | Medium |
| Okta-Sign | Yes | Yes | Yes | Yes | Yes | Yes |
| Active Directory | Yes | Yes | Yes | Yes | Yes | Yes |
| Conditional Formatting | Yes | Yes | Yes | Yes | Yes | Yes |
| Filters Using Sliders | Yes | N/A | N/A | Yes | Yes | Yes |
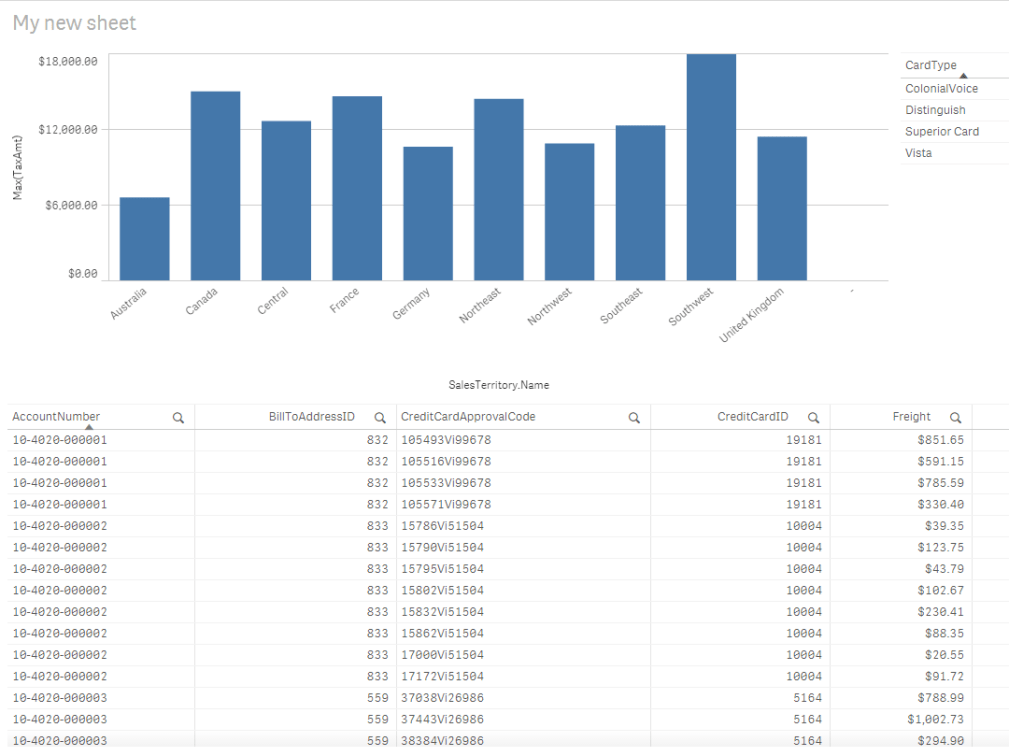
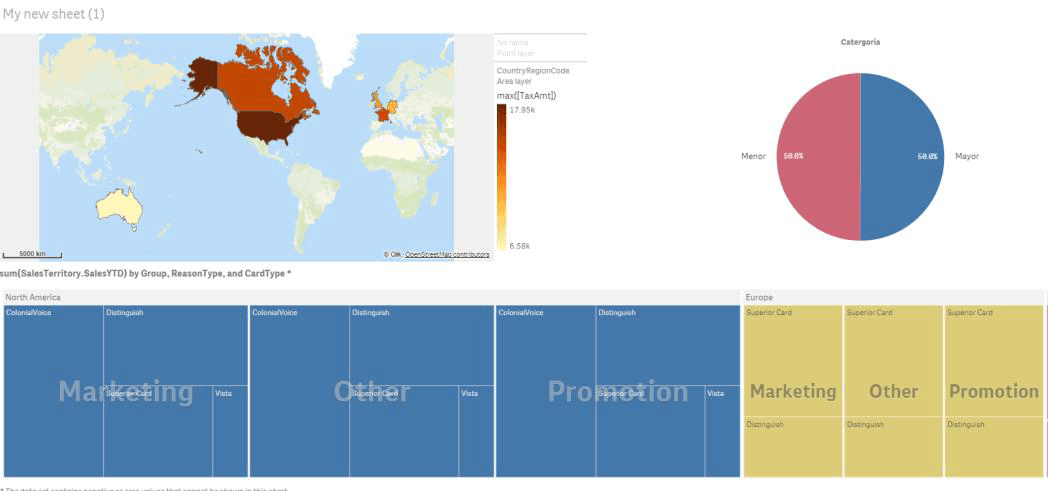
Qlik Sense
Qlik Sense has an intuitive user interface, especially for business users who need self-service analytics. Qlik’s Associative Engine can connect to multiple data sources and easily blend them to fulfill the data needs. It offers an easy way to build visualizations that contain a variety of graphs, tables, and filters.
Users can access the reports via mobile devices using a free app that can be downloaded from different app stores. You can get automatic insights, meaning the tool can analyze the dataset and create or modify pre-built reports in the dashboards. Users can also include R and Python code to extend the functionality for end-users.
Pros
- Very simple and intuitive interface
- Fast performance
- A huge online community to help find solutions
- Advanced data preparation capabilities that require basic data programming skills
- Can embed statistical languages like R
Cons
- Not easy to add extensions as they need to be certified
- The environment is divided into apps and you can’t connect with prebuilt apps. Requires creating a third one if you want to blend sources.
- Limited capabilities so you need to get creative in order to accomplish some objectives
- A limited number of visual components
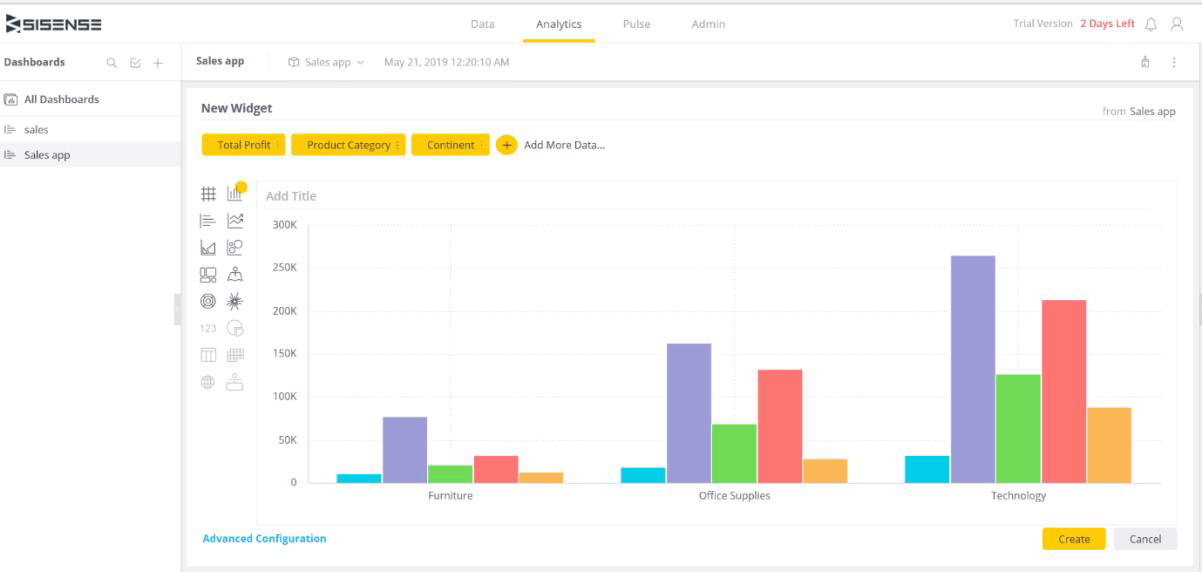
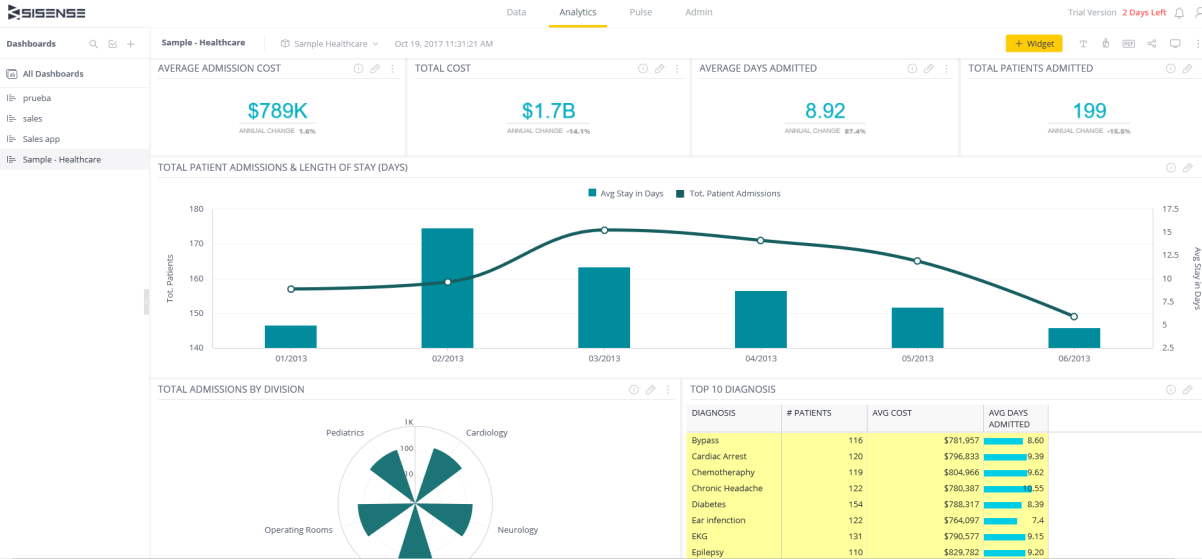
Sisense
Sisense allows you to create ad hoc queries for different data sources using self-service analytics capabilities. There are two ways to connect to your data sources – using ElastiCube or Live Connect. ElastiCube connects to your data source and uploads the selected data to Sisense. Live Connect can process near real-time data and run queries directly against the data source. It provides system-level, object-level, and data-level security. It has a simple UI and uses Machine Learning to provide insights into your data. Users can also connect Sisense with the R server and use R functions.
Pros
- Very good performance
- User-friendly interface
- Dashboards and visualizations are intuitive and easy to use
- Insight Miner add-on uses Machine Learning to uncover hidden insights
Cons
- Not exactly real-time data
- Limited options for data visualization
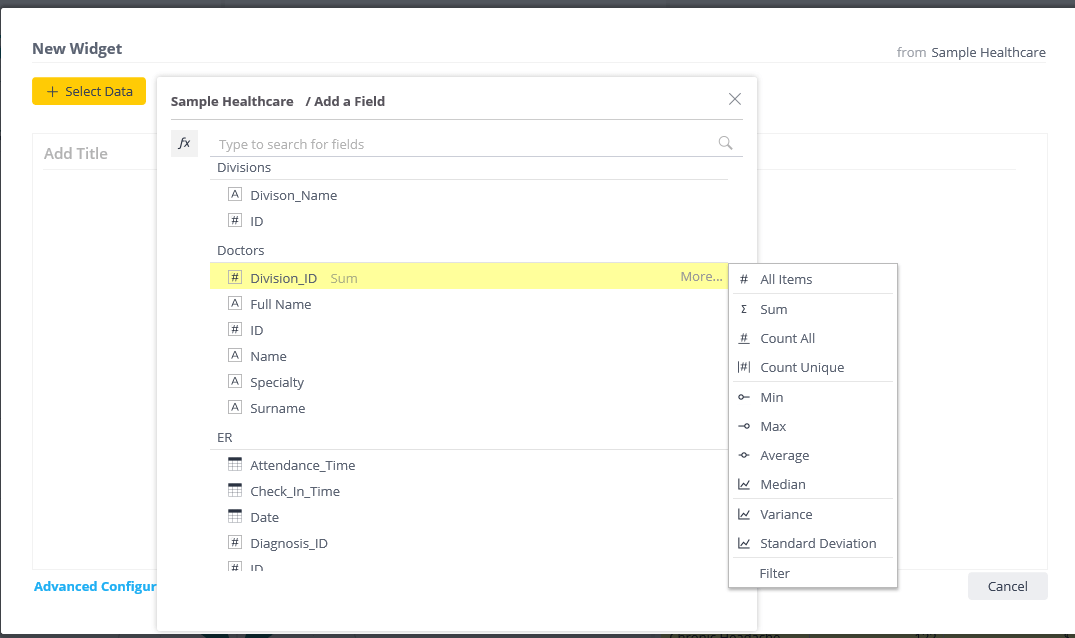
- You cannot see all the columns of your dataset when you create a widget
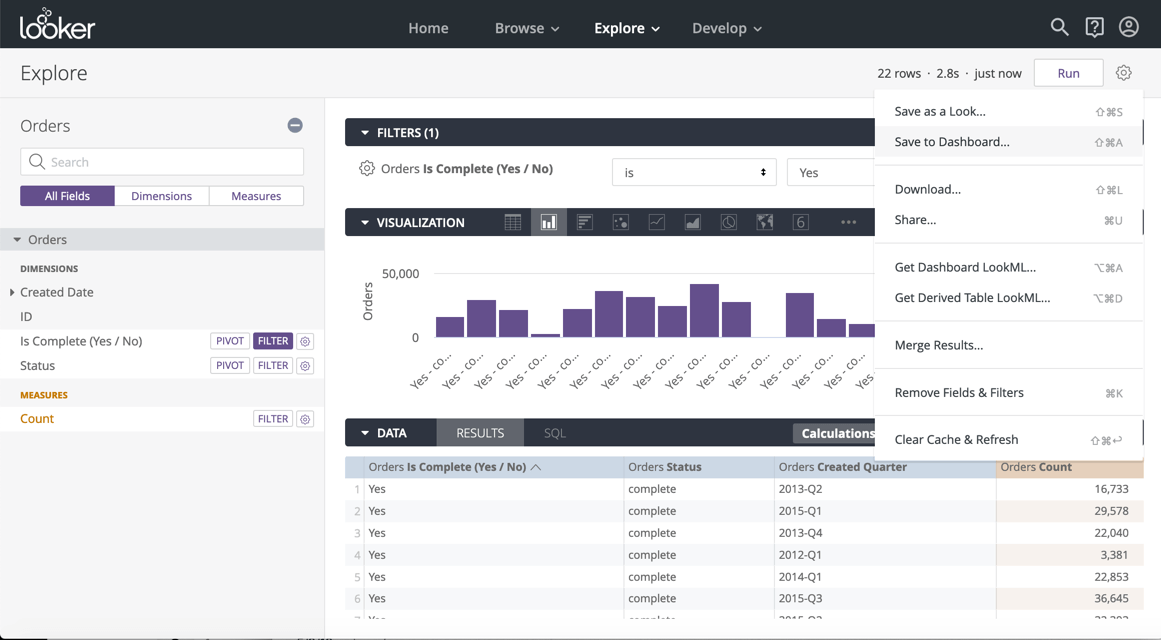
Looker
Looker has a different approach when compared to the other self-service analytics tools in the market. It has a data modeling layer using LookML which is like a metadata repository of your different sources. Users need to create a model first in order to perform self-service analytics or create any data visualizations in Looker. This model consists of dimensions and facts. Data visualizations are very intuitive and allow you to see all the available columns of your model in the left panel. You can select the columns you want, create filters, and run the query.
Pros
- Very good performance
- The tool offers a lot of flexibility
- Very user-friendly interface for creating content
- Robust data governance capabilities
Cons
- Need to learn LookML language to create the models
- Need to design data models based on your sources before using the tool
TIBCO Spotfire
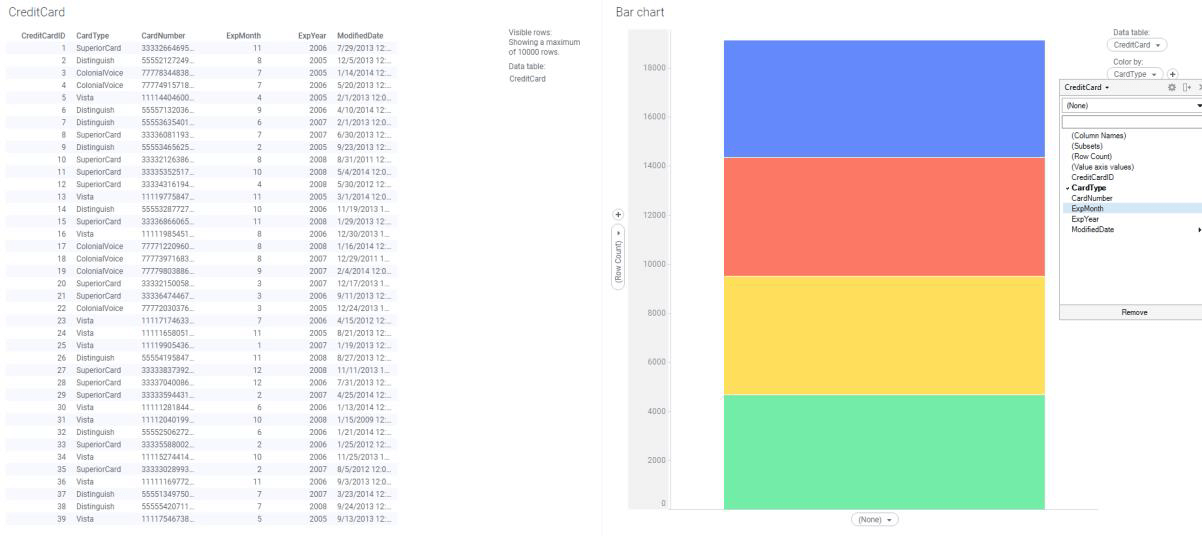
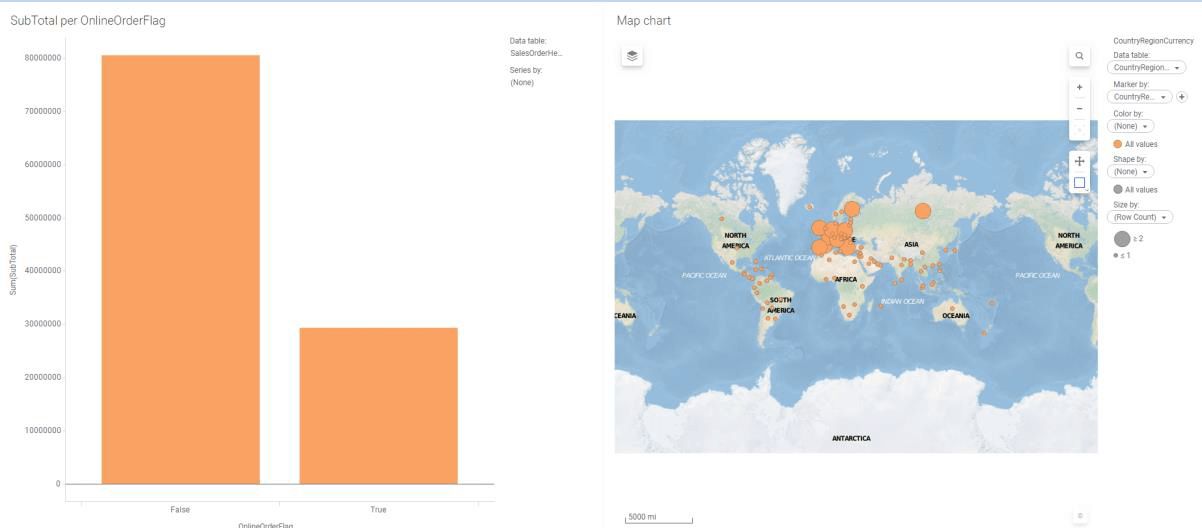
TIBCO Spotfire is not as intuitive as the others but offers powerful analytics capabilities. One good feature is the option to easily explore data and find data outliers, inconsistencies, and deficiencies. It has an inbuilt predictive analytics engine that expands the ways in which users visualize their data. It also offers an inbuilt R machine. One of the main areas of strength of this tool is the ability to configure real-time streaming analytics. The trial version doesn’t offer the ability to blend database sources, so we didn’t test that feature.
Pros
- Number of visualization components
- Can embed statistical code with R or Python
- Easy data extraction
- Very good performance
- Works well with big data tools
Cons
- Not easy to learn
- Very large data cause the application to crash sometimes
- Most connections use Java Database Connectivity (JDBC)
- Not the best tool for data blending
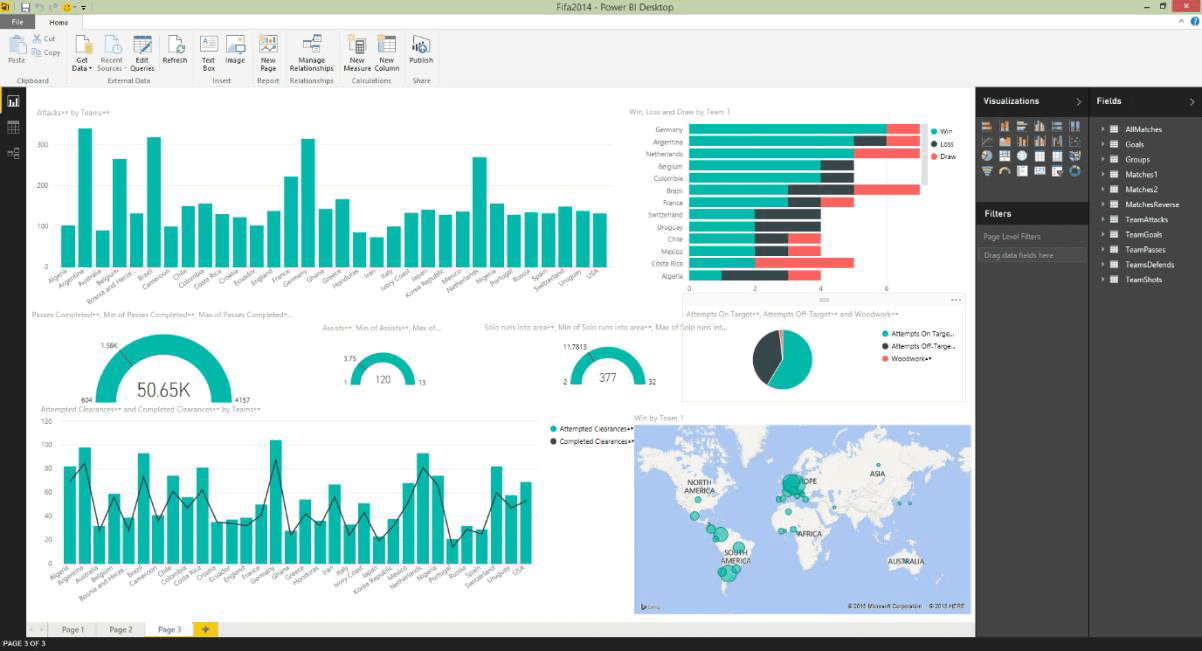
Power BI
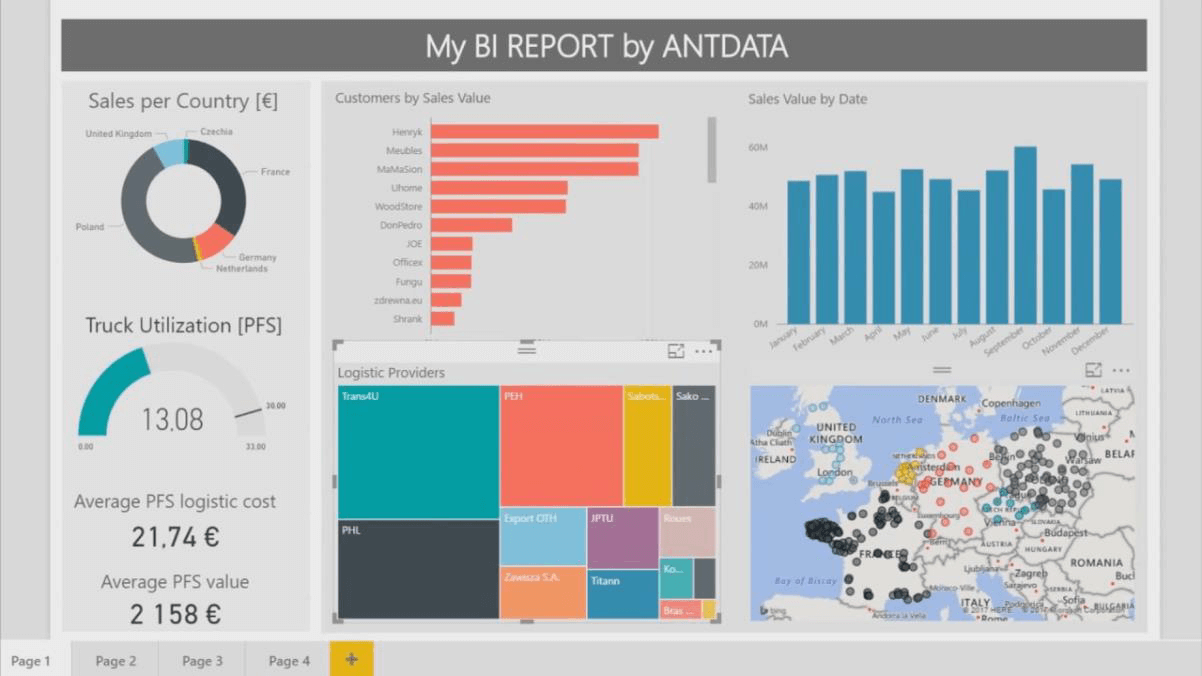
Microsoft Power BI allows users to visualize data and share insights across the organization. It can connect to multiple data sources and allows data extraction and direct query connections. It fully integrates with other Microsoft tools such as SharePoint, Teams, and Office. It has a transformation tool that allows users to blend and modify data from multiple sources, and present it to final users.
Pros
- Easy to use
- Constant updates with new features
- A number of data source connections
- Ability to create custom visualizations
- The very active user community
Cons
- Rigid formulas, it uses DAX as the language for calculations
- Free versions have data handling limitations
- Visualizations have limited configuration options
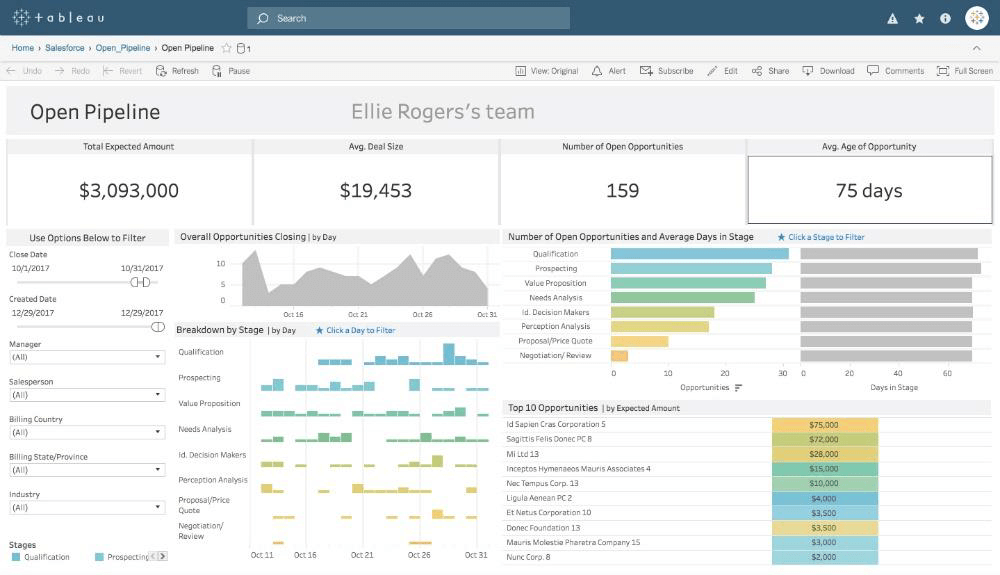
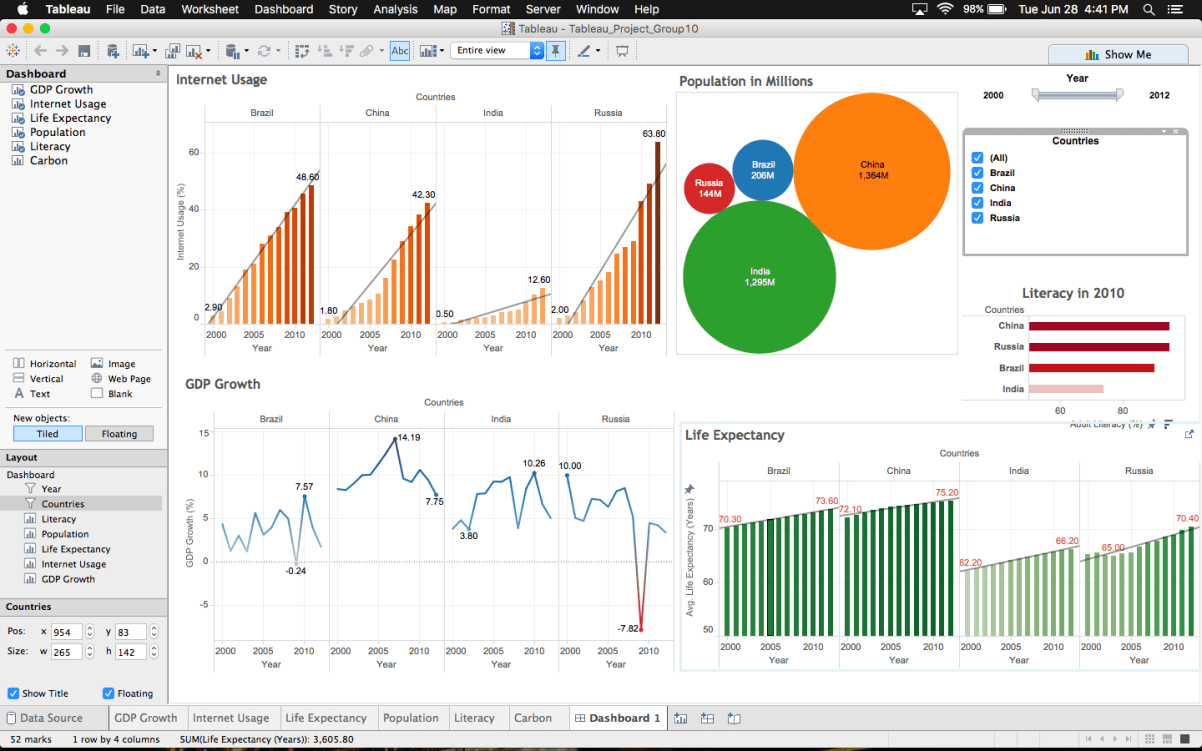
Tableau
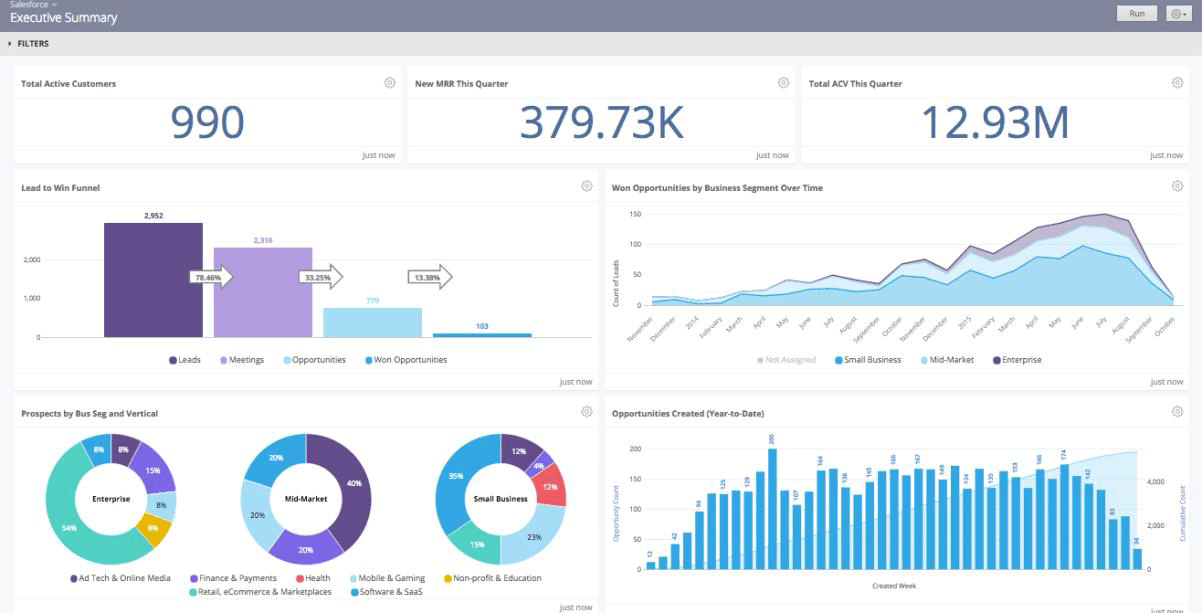
Tableau can create a wide range of data visualizations to interactively present the data and showcase insights. It offers deep drill-down capabilities as well as real-time analytics and cloud support.
Pros
- Great performance
- A large number of visual objects
- Ability to blend diverse data sets
- Easy to learn and use
- Centralized data repository
- The active community of users
- Many official resources available for knowledge and training
Cons
- Requires IT expertise for certain configurations
- No versioning on server
- Requires knowledge in R or Python for analytics