What is Observability and Management Platform
IT leaders can enhance their monitoring capabilities, processes, and culture by adopting observability, which can provide valuable insights for managing applications regardless of the cloud they are deployed on. With observability, IT teams can enjoy easier management of applications and gain greater visibility into their performance.
Observability is the characteristic of software and systems that allows them to be “seen” and allows questions about their behavior to be answered.
Tools that leverage and facilitate software observability allow an observer to collect and explore external- and internal-state data using automated and exploratory techniques that iteratively reduce the universe of potential explanations for errant behavior. These insights are useful to groups within and outside of I&O, such as DevOps and SRE teams that may be the primary consumers.
Key Insights
By 2024, 30% of enterprises implementing distributed system architectures will have adopted observability techniques to improve digital business service performance, up from less than 10% in 2020.
Why is it Becoming Important
Observability is critical for digital infrastructure operations, providing insights for IT teams to quickly analyze and act on performance metrics and traces. It includes monitoring infrastructure, applications, and end-users, and is increasingly important for assuring reliable online experiences.
The ongoing pandemic is increasing the urgency for supporting online, remote, and mobile access to critical business and health services. IT organizations are being hard-pressed to assure that users – especially remote workers – receive fast, reliable, and secure on-line experiences regardless of spikes, heavy load increases and unpredictable demand patterns. Observability satisfies the need to know what’s going on? where? why? and what is likely to happen in the future. Observability includes monitoring and visualizing what is happening across the IT landscape, including infrastructure, applications and end-users. It has become one of today’s hottest topics, and is a necessity for IT operations, DevOps teams, developers, and business service owners.
Components of Oracle’s Observability and Management
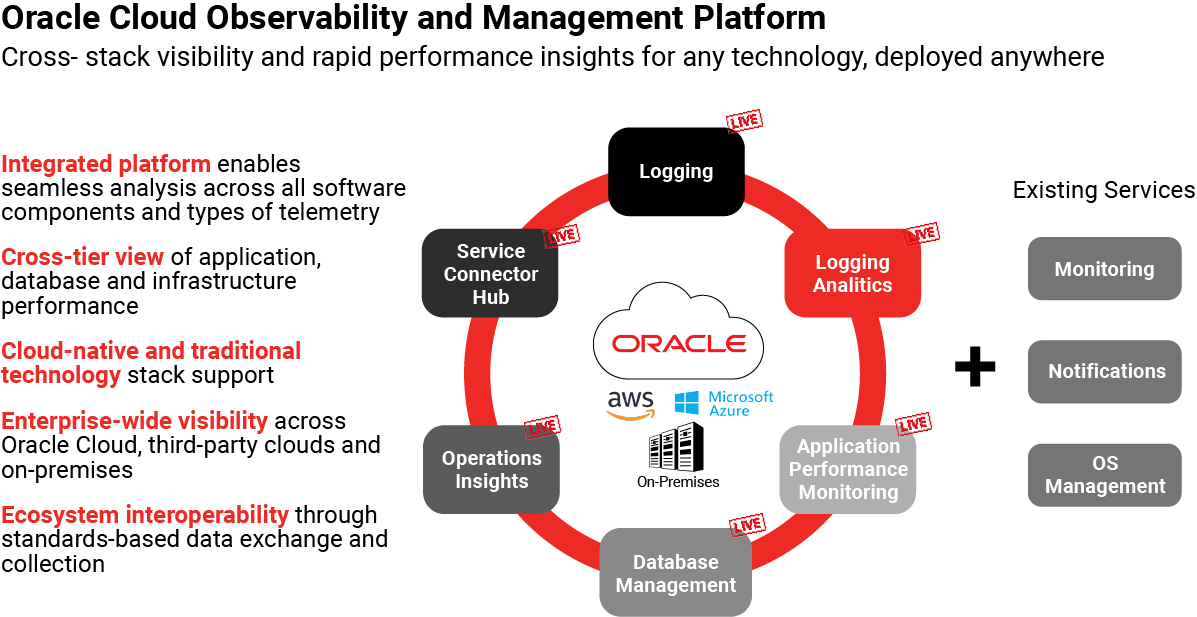
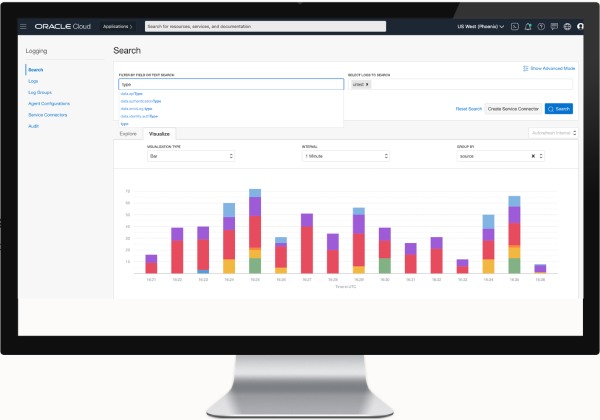
Logging
When running your workloads in the cloud, you will have logs generated from every point in the stack: Infrastructure, Database, Audit, Application, and on-premise. Logging services offers you a centralized experience to brings all of these logs in one view.
It is natively integrated with your OCI resources for a seamless 1 click experience to turn on logs. It gives you the ability to manage and secure your logs, to ensure only the authorized users have access to your sensitive data.
And with all of your logs in one view, you are able to easily view and correlate logs across your entire stack into a clean layer cake experience.
Logging is all in on Cloud Native open standards. Our log ingestion experience is powered by fluentd, allowing you to leverage community open source plugins. And every single log event ingested into the system is automatically normalized to CNCF’s cloud events 1.0 schema; allowing to to easily interop with the rest of the cloud native ecosystem.
Logging also allows you to make every log line actionable in near real time by integrating with the service connector hub. With this integration, you can easily push your logs to 3rd party destinations, or take action on them with service connectors.
Finally, all of this is provided to you at industry leading pricing, allowing you to cut your logging bill in half.
Centralized log management
- Simple one-click experience to turn on logging across your entire fleet
- Secure management for all log types: audit, infrastructure, database and applications
- Search & correlate logs from all sources into one clean layer cake view
Intuitive rules based actions
- Act on every log event with service connectors
- Seamlessly move logs to any destination or 3rd party observability tools
Built on open standards
- Leverages fluentd for ingesting logs
- Compliant with CNCF cloudevents 1.0
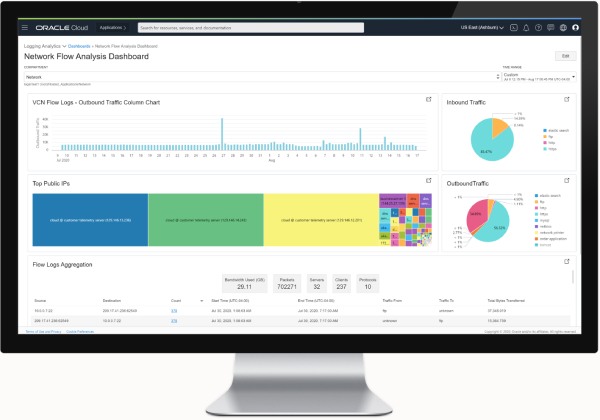
Logging Analytics
When it’s time for advanced analysis, you can escalate to our Logging Analytics service, which provides capabilities for exploring and analyzing massive volumes of log telemetry. It has a rich set of curated machine learning-powered insights such as Cluster, Link, Correlate and more, that enable quick diagnostics without the need for data scientist involvement. Logging Analytics makes it easy to unlock the value of your log data. With features like out-of-the-box faceting coupled with powerful visualizations, you’ll be able to quickly find the “needle in the haystack” among millions of rows of logs. You’ll be able to instantly answer questions such as “is this normal?” or “what’s the pattern?”
For more sophisticated users, it also provides a powerful query language with more than 70 primitives for more advanced analysis.
And we’ve made the work easy for you with hundreds of out-of-the-box parsers for a wide variety of Oracle and non-Oracle technologies – both commercial and open source. Logging Analytics will also provide out of the box interpretation (such as error classification) of your Oracle logs, ensuring that you spend less time searching and more time improving.
And with complete control over data archive and recall, you can meet your compliance and retention requirements at the minimum cost.

Data analytics and exploration
- Easily visualize and analyze log patterns and outliers
- Topology-aware exploration & drill-downs
- Curated ML algorithms find anomalies in real-time: Cluster, Link, Classify, etc.
- Rich query language with 70+ primitives
Data archival and recall
- Archive and recall logs based on user-defined policies
- Enables long-term retention at low-cost
Parsers for heterogeneous technologies
- Rich collection (250+) of out-of-box parsers for Oracle and non-Oracle stacks
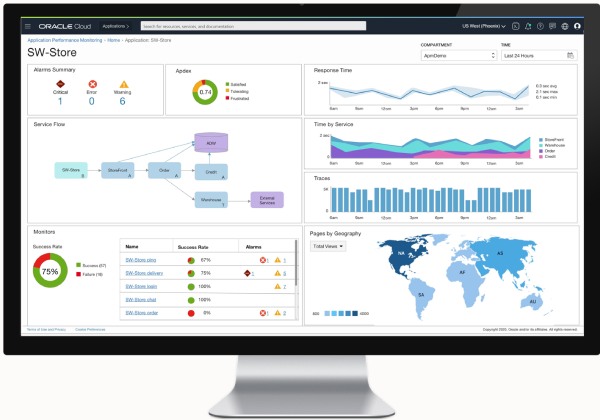
Application Performance Monitoring
Our Application Performance Monitoring – APM – service provides deep visibility into the end-user experience.
The service automatically monitors real-user activity and interaction with your most important applications, including performance measurements and user satisfaction scores such as Apdex.
The core of the service is an implementation of a Distributed Tracing System, supporting OpenTracing enabled microservices and auto-instrumentation of legacy applications, providing integrated end-to-end transaction tracing across new and old components.
You can also proactively initiate synthetic transactions, where pre-defined critical application flows are executed from vantage points across the world, so you can assess exactly what kind of experience users from different parts of the world have with your app. In this way you can ensure the performance and functionality of your most critical application flows.
And, since the APM service is integrated with all our other services, you can extend the analysis to other tiers of the stack with in-context drill down to logging analytics, DB management, and other services.
End-user and server monitoring
- Measures end-user performance from browser to application
- Deep monitoring with in-context drill-downs across tiers and logs
- Performance, availability and load analysis with rich set of server, browser, and transaction metrics
Synthetic monitoring
- Runs pre-defined transactions from global vantage points for proactive monitoring
Distributed tracing
- Full capture and analysis of all traces for fine-grained problem diagnostics
- Compatible with OpenTracing and OpenMetrics
Database Management
The new Database Management service brings the best of Oracle’s industry-leading database management capabilities into Oracle Cloud.
This includes fleet-wide monitoring and management for all types of Oracle Database, whether they are deployed on-premises or in the cloud. So, if you’re using Database 12c or 21c, single instance or RAC, standard architecture or Multitenant, Autonomous Database, shared or dedicated, or the Exadata Cloud, you’ll be able to get a comprehensive view of the performance of your database fleet.
You’ll be able to leverage diagnostics and tuning capabilities you are very familiar with such as ASH Analytics (pronounced “ash analytics”), AWR reports, ADDM (pronounced “adam”), Real-time SQL Monitoring and more. And you’ll be able to perform common administrative tasks like changing init.ora (pronounced “init dot ora”) parameters, managing tablespaces and users, and also performing backups as needed.
Oracle Enterprise Manager has been a leader in database management for Oracle Databases for a long time and now these widely used capabilities are available in the Oracle Cloud.
Fleet monitoring and management
- Unified view for monitoring and managing Oracle DB fleet across on-premises and cloud
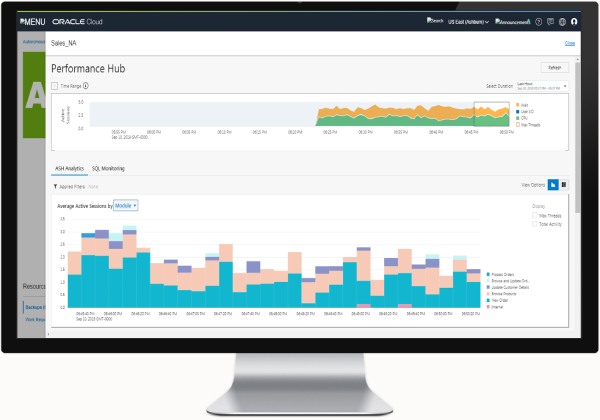
Performance Hub
- Integrated view of DB activity for easy performance diagnostics
- Features include ASH Analytics, SQL/ Session details, Blocking sessions
Real-time SQL monitoring
- Advanced execution plan analysis for monitoring and optimization
Database administration
- Simplified space, configuration, users and backup management
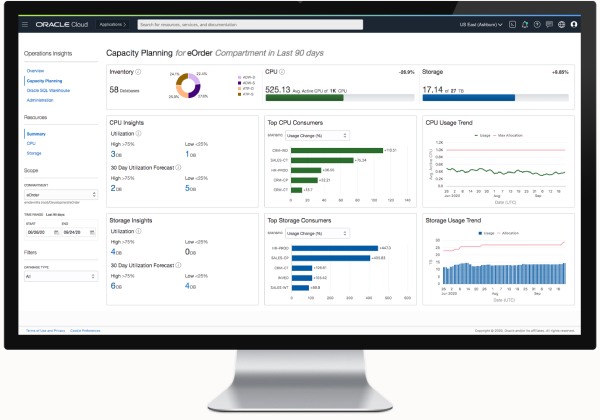
Operations Insights
Operations Insights Service utilizes longer-term telemetry data (up to 25 months) and augments it with machine learning to provide two sets of capabilities: Capacity Planning and SQL Warehouse.
With Capacity Planning you can analyze your current compute resource usage and trend, and use smart, seasonality-aware forecasting algorithm to understand upcoming compute demands and proactively identify impending resource issues. Initially this capability will be available for Oracle Databases in OCI only but we will shortly thereafter support forecasting and planning for any server or VM, on-premises or in the cloud.
The other key capability of this service is SQL Warehouse. This warehouse stores SQL along with its execution stats for your entire fleet of Oracle Databases and enables long term SQL performance analysis. It helps you find common patterns of SQL issues and also helps spot systemic and recurring problems such as degrading performance, variation in response times, changing execution plans, poorly written SQL and so on. This helps you leverage your DBA expertise by identifying common and high-value targets for enterprise-wide tuning as opposed to tuning one-DB-at-a-time.
With Operations Insights, you’ll be able to reduce the cost of operations, predict and plan for future demand, and maximize utilization of both human and compute resources.
Capacity planning
- Analyze and forecast database resource usage based on long-term historical data
- Optimize cost of operations by identifying over- and under-utilized servers
SQL warehouse
- Long term SQL store for performance and trend analysis of Oracle Databases
- Proactively identify and mitigate SQL issues
- Find common patterns in SQL behavior across databases and applications
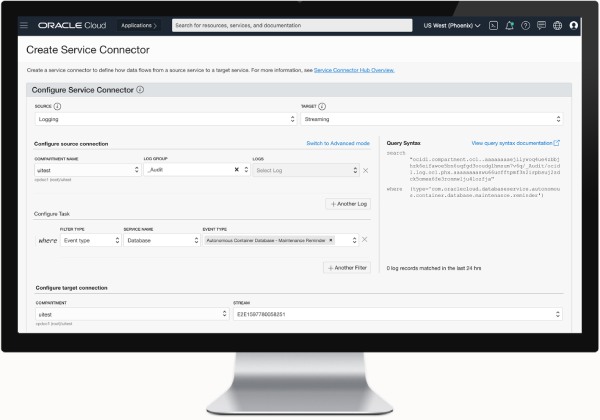
Service Connector Hub
Robust integration with 3rd party tools
We understand that enterprises have complex observability needs, and often use a combination of tools from different vendors. Service Connector Hub makes integration with 3rd party tools easy. Using our Kafka compatible Streaming Service and Oracle Functions, you can move data to any 3rd party tool of your choice, removing the need to retool or change your operational posture.
Complete visibility on Data Movement – In general, cloud providers offer individual service-to-service integrations which makes it hard for Admins to track the various data flows in their environment. Developers also need to go through a learning curve as each individual service-to-service integration has it’s own control plane. Service Connector Hub addresses this pain – it offers a central place where Admins can manage and monitor data movements across all their services, both within OCI and from OCI to 3rd party tools. With Service Connector Hub, Developers have one control plane API which reduces the learning curve when building applications.
Take near real-time actions – The Service Connector Hub makes it easy to move Logs, Metrics and Stream messages to destination sinks like Object Storage, Streaming, Monitoring in near real time and take actions. This could be for the purposes of archiving logs in Object Storage, alarming on logs in the Monitoring Service or for running analytics. It also makes it easy for Developers to build event driven applications that process logs using Functions for custom processing and Notifications for alerts.
Seamless integration with industry tools
- Move data easily to any 3rd party observability tool using OCI Kafka compatible Streaming service
Complete visibility on data movement
- Centralized experience to view, secure and manage all data movement between Oracle services and 3rd party tools
Take near real-time actions
- Easily emit log metrics to OCI monitoring
- One click log archival to Object Storage
- Automated remediation and alerting for log events using functions & notifications
Conclusion
Monitoring, Observability and Management are essential elements for your Oracle applications without which you will be like a Ship captain without a compass or GPS today.
To migrate onprem EBS to Cloud or Optimize and Manage EBS on any cloud, It is highly recommended to leverage certified Oracle Cloud MSE Partners to ensure you avoid any roadblocks in your cloud migration journey and avoid inflating your cloud migration costs and timelines. Contact our experts today!